
Visualizing Success: The Role of Deliverables Diagrams in Project Management
This article highlights the role of deliverables diagrams in project management across both Waterfall and Agile methodologies for ensuring clarity, enhancing communication, and steering projects to success.
Iyanna Trimmingham
6/10/20243 min read


Have you ever tried to navigate a new city without a map, or attempted to complete a complex puzzle without seeing the picture on the box?
I vividly remember my first visit to the USA; my sister highlighted the importance of various maps, especially the subway map, since we were in New York City. We used it to plan all our journeys effectively. To me, it made perfect sense—why fumble through something when you have access to a guide that significantly reduces your chances of failure? Conversely, a friend who ignored this advice found himself lost in an unfriendly neighborhood. After what felt like an eternity, he managed to find his way out and vowed never to forgo a map again.
Similarly, navigating a project without a deliverables diagram is like first-time parents building a baby crib without the manufacturer’s guide—possible, but more complicated than it needs to be. Today, let’s unpack why a deliverables diagram isn't just helpful; but can be crucial for project success.
Understanding Project Lifecycles Across Methodologies:
Every project management methodology, from the structured steps of Waterfall to the flexible iterations of Agile, operates under one common principle: the clearer the path, the smoother the journey. Here’s how deliverables diagrams facilitate this clarity:
Waterfall Methodology:
The Waterfall model is linear and sequential, where each phase (initiation, planning, execution, monitoring, and closing) must be completed before the next begins. This method thrives on detailed upfront planning and clear, well-defined milestones.
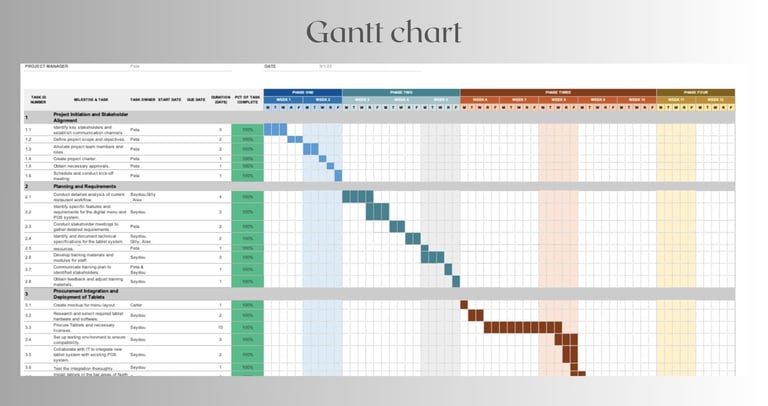
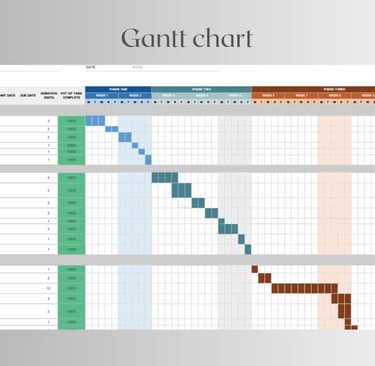
Deliverables Diagrams in Waterfall: In this context, diagrams such as Gantt charts or flowcharts illustrate the entire project timeline, showing dependencies, milestones, and deadlines. For example, in a software development project, a Gantt chart can detail when the software development stage will begin, its key deliverables, and how it aligns with testing phases.
Agile Methodology:
Agile is characterized by its iterative process, where projects are divided into sprints with goals that adapt based on ongoing feedback and results. This approach values flexibility and responsiveness to change.
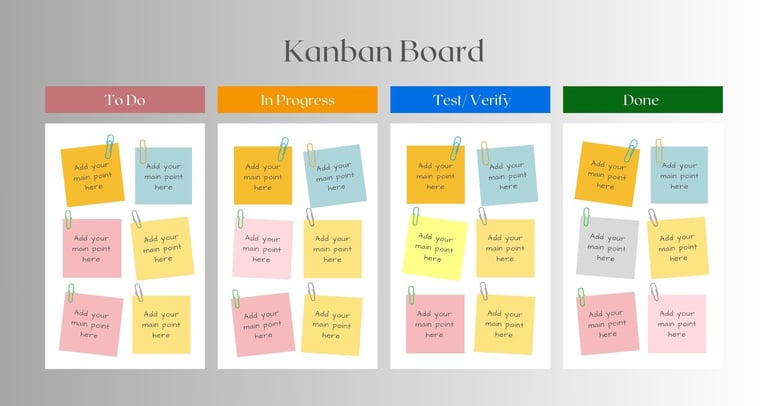
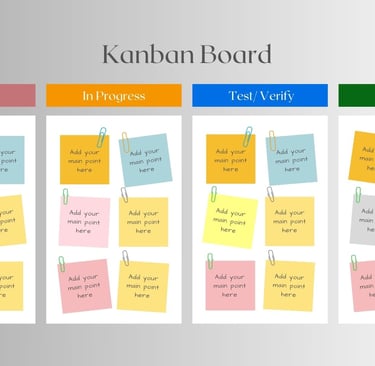
Deliverables Diagrams in Agile: In Agile projects, diagrams like sprint burndown charts or Kanban boards are crucial. These tools provide a dynamic view of the project's progress, highlight pending tasks, and adapt to the project’s evolving needs. For instance, a Kanban board can visually organize tasks into columns such as "To Do," "In Progress," and "Completed," offering real-time status updates and facilitating quick adjustments.
Expanding on Communication Strategies:
Effective communication is foundational in project management. Deliverables diagrams enhance this aspect by providing a universal language that all stakeholders can understand.
In Waterfall: Communication plans might include regular status meetings supported by updated Gantt charts to track progress against the baseline. These meetings ensure that all stakeholders are aware of the project timeline and any deviations from the plan.
In Agile: Communication is more frequent and informal, often daily. Tools like Kanban boards are updated in real-time and are accessible to all team members, facilitating transparency and immediate feedback. Regular sprint reviews and retrospectives use visual aids to discuss what was accomplished and what needs to change.
Deliverables diagrams are more than just tools; they are essential navigational aids that help project managers steer their projects with precision. Whether through a Gantt chart guiding a Waterfall project or a Kanban board mapping an Agile sprint, these visual aids ensure that everyone—from team members to stakeholders—is aligned with the project's goals and progress.
Think about your last project: Did you use a deliverables diagram? How did it impact your project’s outcome? Share your thoughts and experiences below. Let’s explore together how we can further utilize the power of visualization in project management for better results!